
Summary
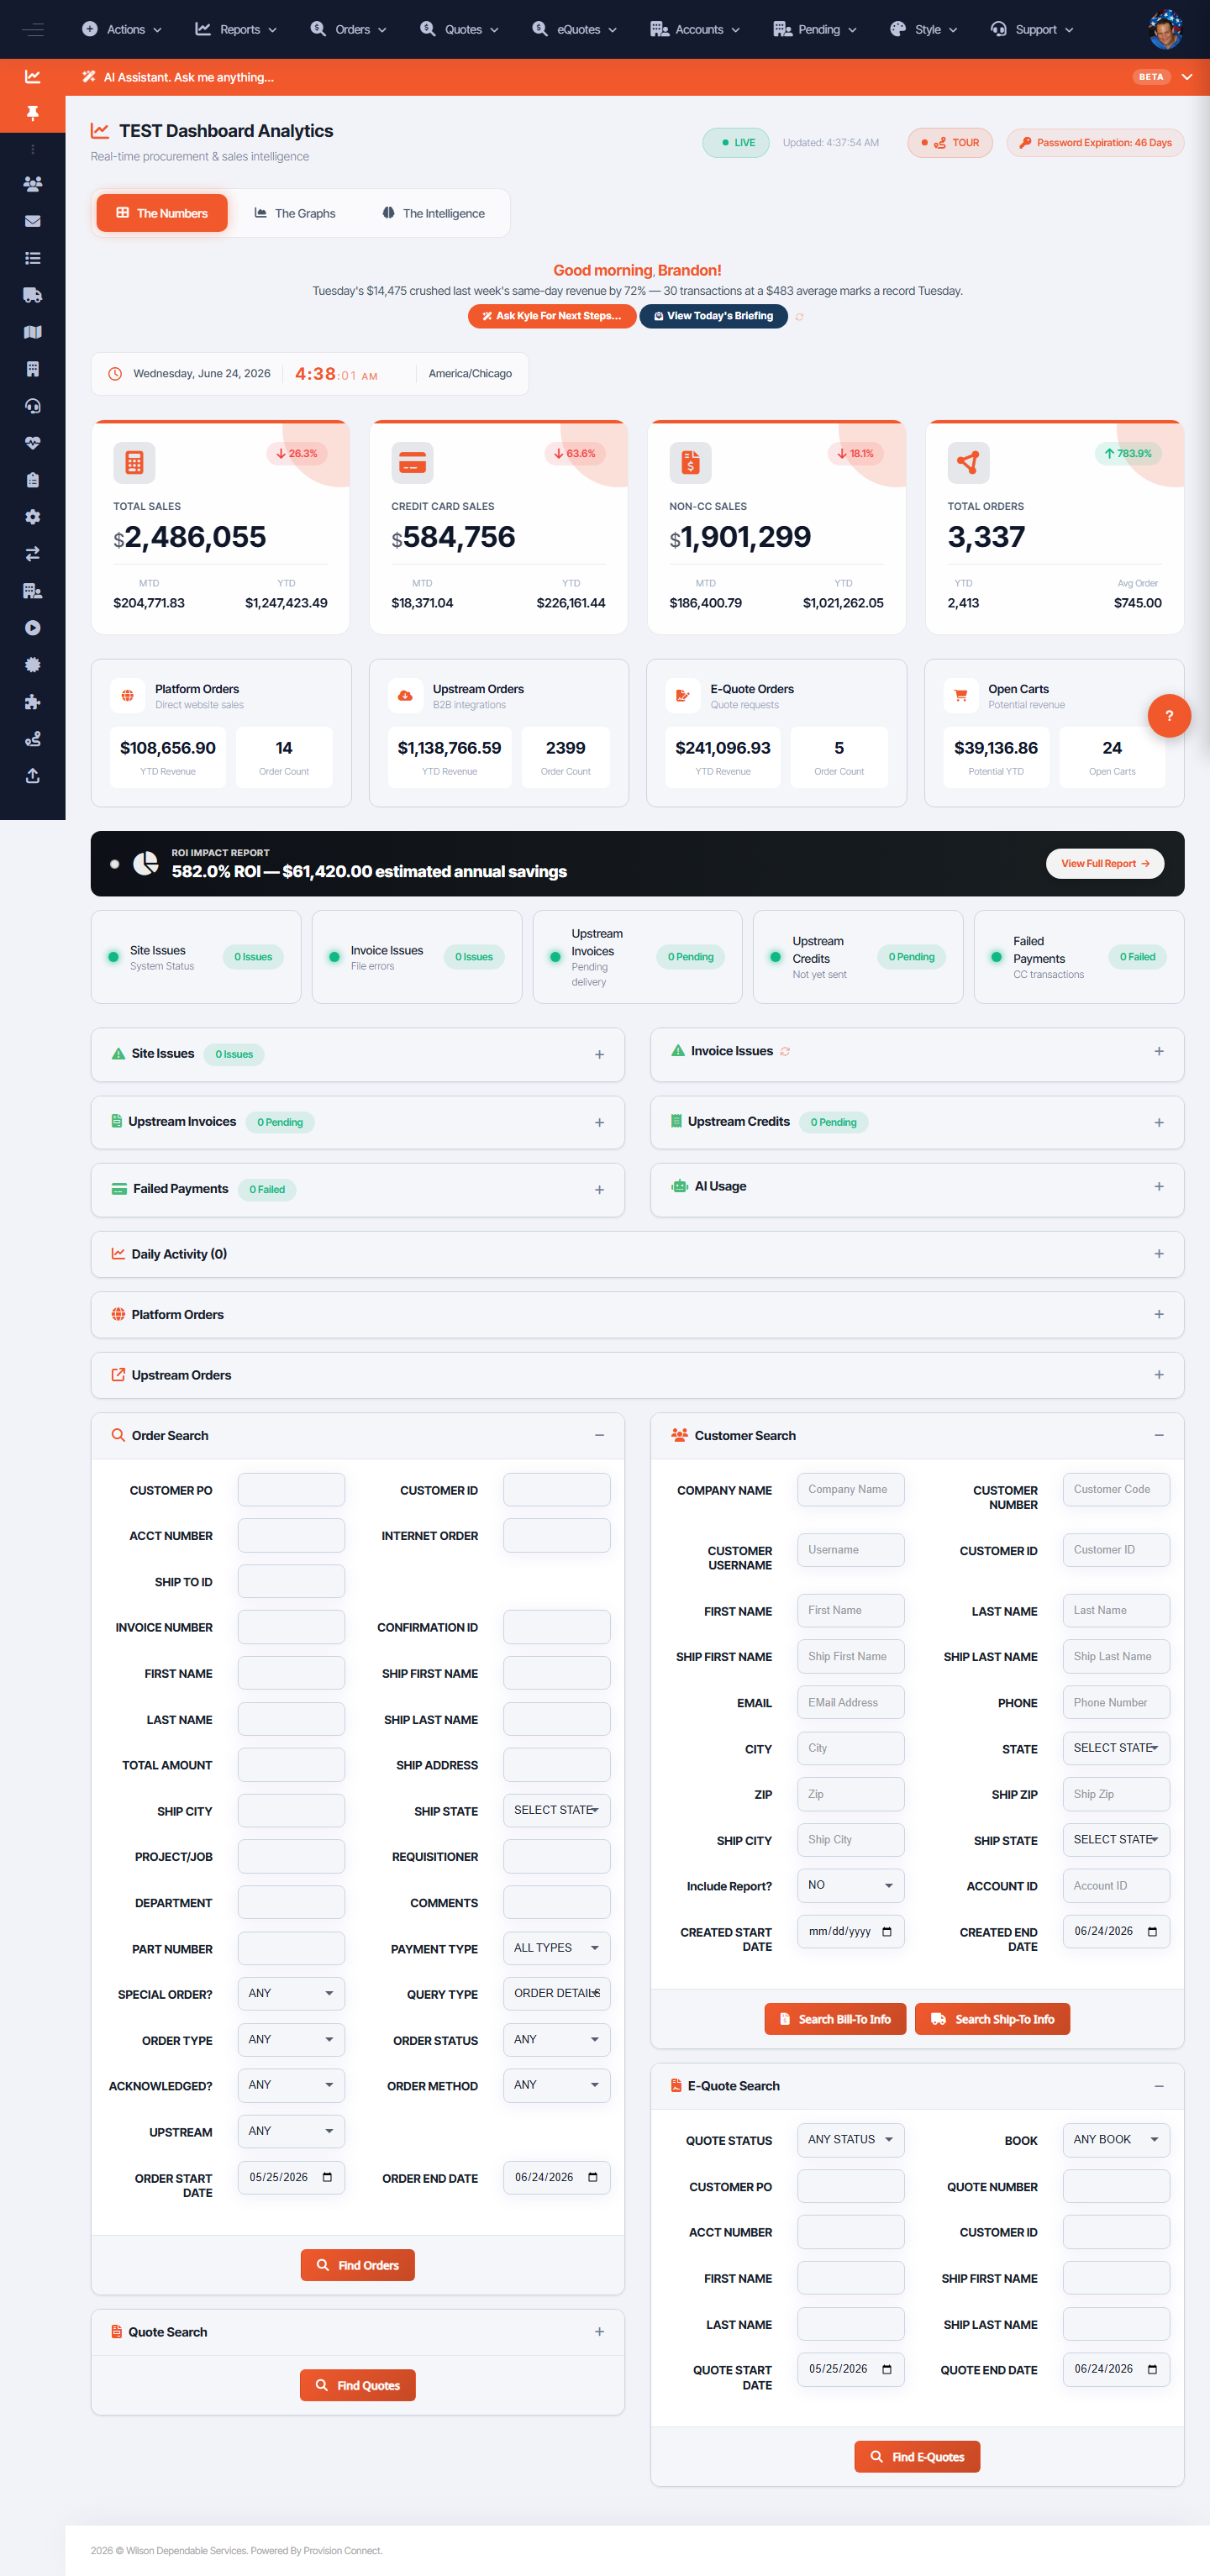
The dashboard (WDS Dashboard Analytics) is the home screen: live sales and order metrics, channel breakdowns, and operational-health tiles, plus the Kyle assistant and order/quote/customer search. Three tabs — The Numbers, The Graphs, The Intelligence — switch between figures, charts, and AI insight.
Before you start
- Required role: Admin (or Reseller Admin)
Steps
- Open the Dashboard (
/). - Read the headline tiles: Total Sales, Credit Card Sales, Non-CC Sales, Total Orders (each with MTD/YTD).
- Check channel tiles: Platform Orders, Upstream Orders, E-Quote Orders, Open Carts.
- Scan operational health: Site Issues, Invoice Issues, Upstream Invoices, Upstream Credits, Failed Payments.
- Switch tabs to The Graphs for trends or The Intelligence for the AI summary; use TOUR to replay the page tour.
What success looks like
You get a one-screen read on revenue, order volume by channel, and any operational issues needing attention.
Gotchas / troubleshooting
- Non-zero Site Issues / Invoice Issues / Failed Payments are the tiles to act on first.
- The daily insight line summarizes anomalies (e.g. "two weekends with zero transactions") — use Ask Kyle For Next Steps to dig in.
Related
- Ask the Kyle AI assistant
- Search for orders, invoices, and quotes
- View real-time site analytics