
Summary
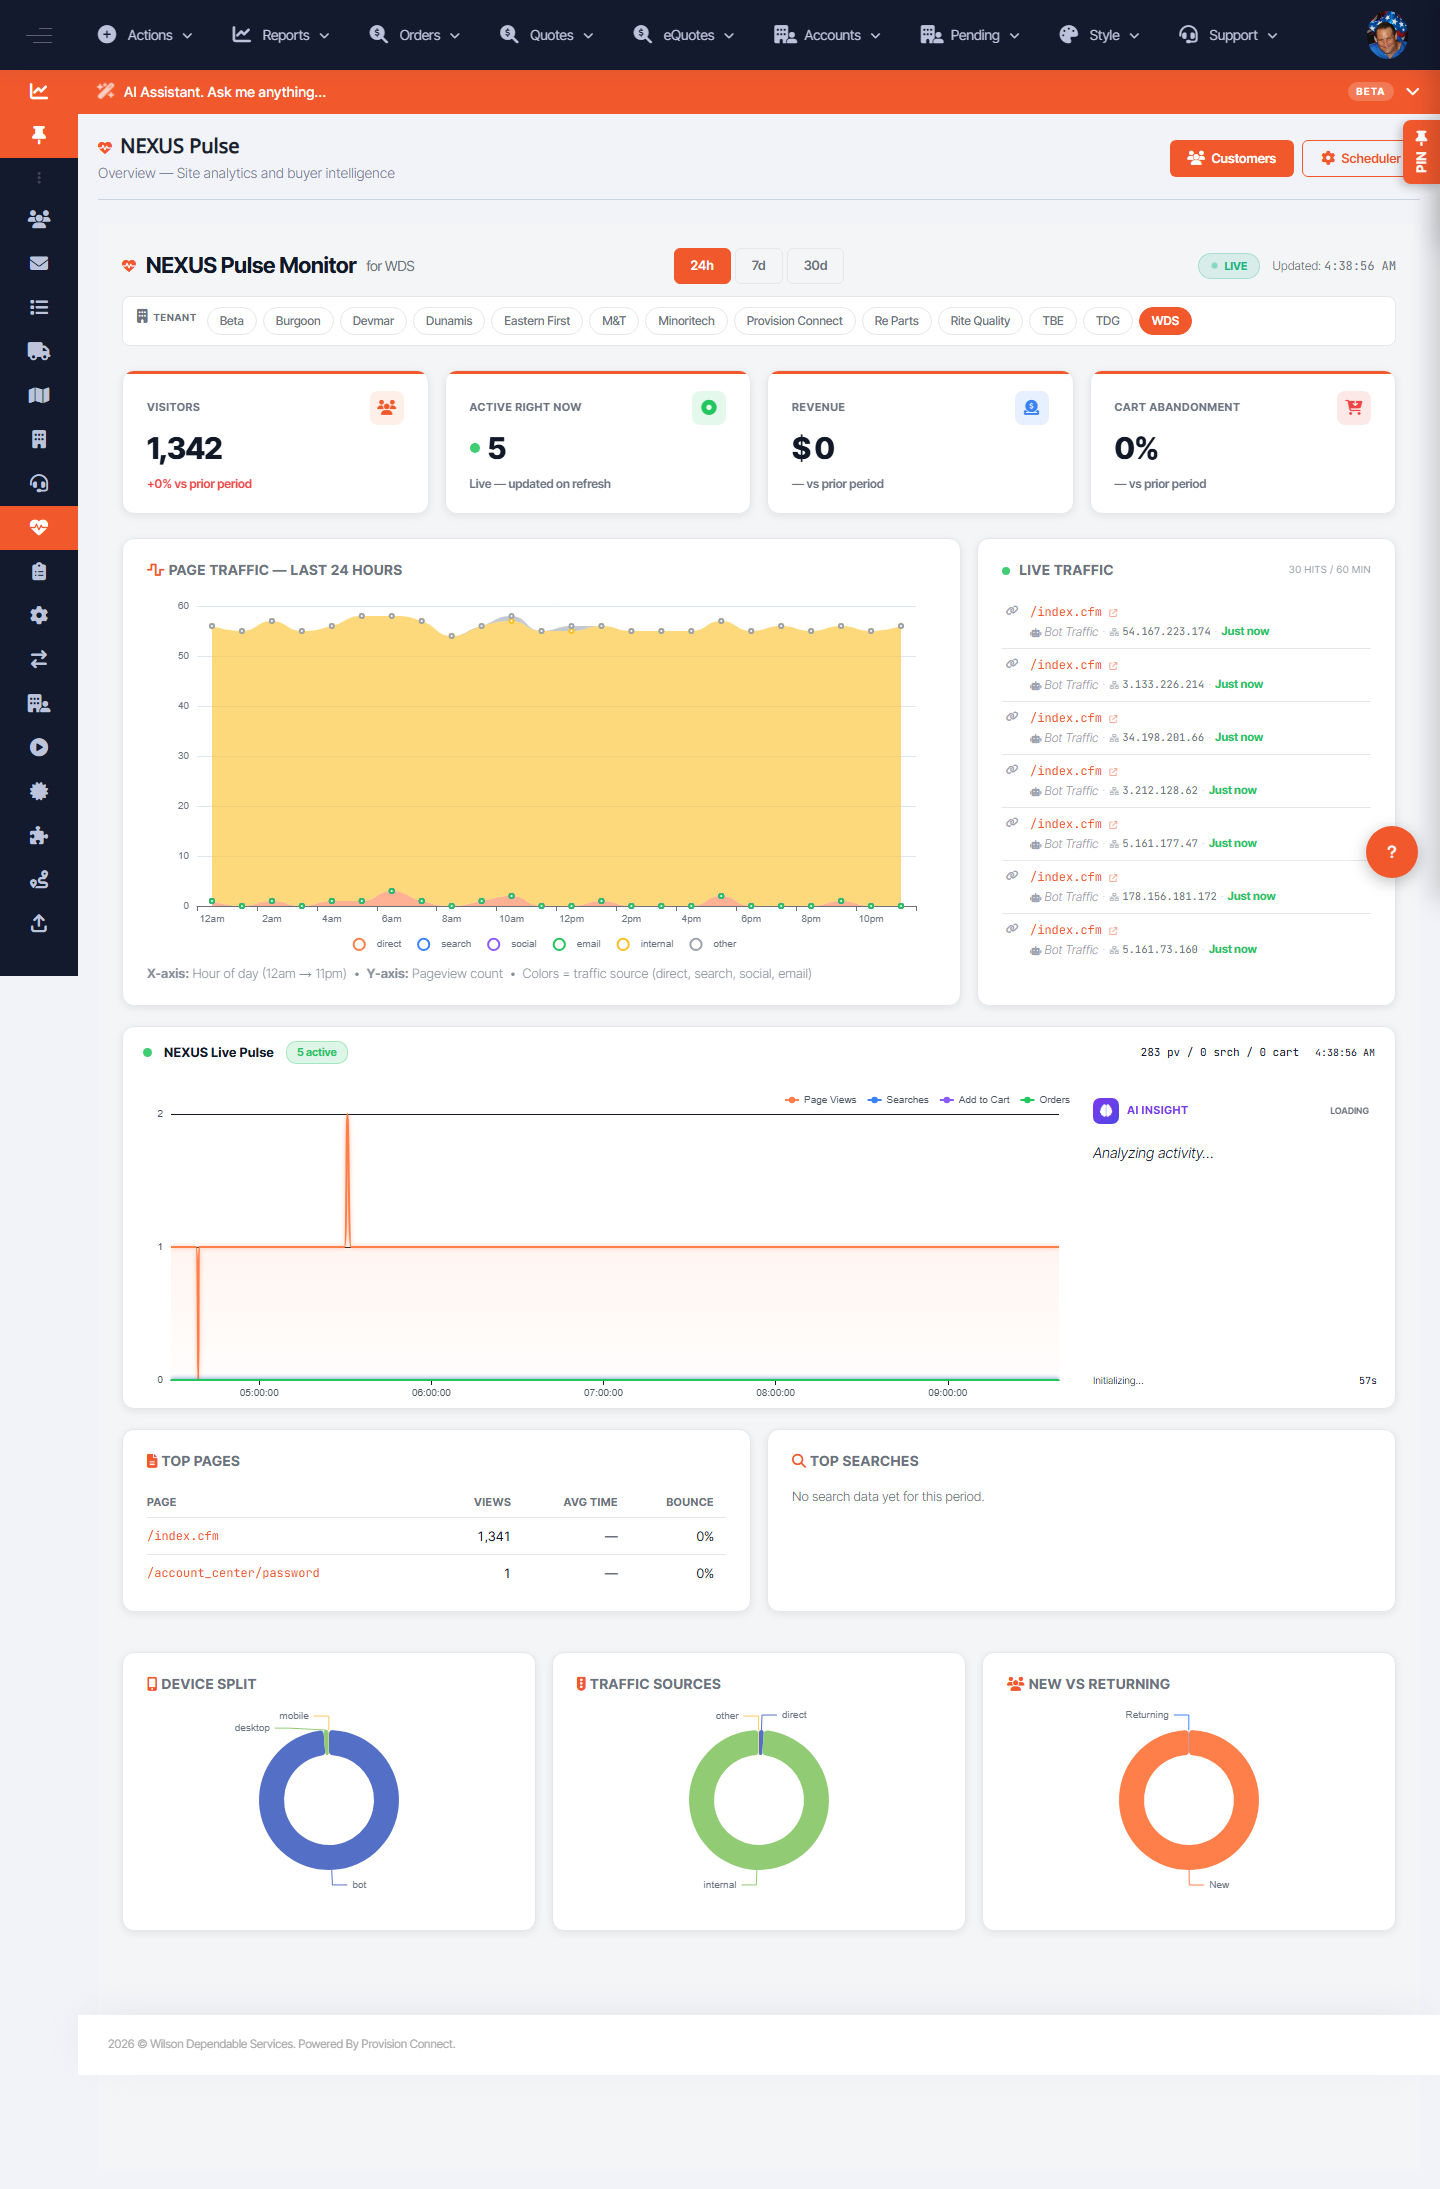
NEXUS Pulse Overview is a live analytics monitor for a tenant's storefront. It shows visitors, who's active right now, revenue, cart abandonment, an hourly traffic chart, a live hit feed (visitors vs bots with device/IP), an AI insight summary, top pages, top searches, device split, traffic sources, and new-vs-returning.
Before you start
- Required role: Admin (or Reseller Admin)
Steps
- Go to NEXUS Pulse ? Overview (
/nexus_pulse.cfm). - Pick the Tenant from the selector (e.g. WDS, Rite Quality).
- Choose a time range: 24h / 7d / 30d.
- Read the live tiles (Visitors, Active Right Now, Revenue, Cart Abandonment) and scroll for Top Pages, Top Searches, Device Split, Traffic Sources, and the AI Insight callout.
What success looks like
The monitor updates on refresh with current visitor counts and a live hit feed, and the AI Insight summarizes what the current traffic pattern means.
Gotchas / troubleshooting
- The live feed distinguishes Bot Traffic from real Visitor hits — don't read bot hits as buyer activity.
- "Active Right Now" and the live feed refresh on page reload, not continuously.
Related
- View customer intelligence in Pulse
- Configure Pulse scheduled digests